The Item Response Warehouse (IRW)
A free, open collection of harmonized item response data for psychometrics and measurement research.
Read the paper (open access)
Why the IRW exists
Researchers who study measurement — in education, psychology, and related fields — need real data to test and compare their methods. That data already exists in large quantities. But it is scattered across many studies, stored in many different formats, and often hard to reuse because of unclear documentation or licensing.
This is a well-known problem. The research community has articulated a shared standard for solving it: data should be FAIR — Findable, Accessible, Interoperable, and Reusable (Wilkinson et al., 2016). Other fields put these principles into practice by building shared, standardized data resources. In computer science, the ImageNet collection of labeled images gave researchers a common benchmark and helped drive rapid progress in AI. Genetics and neuroscience built similar shared resources for their own data.
The Item Response Warehouse (IRW) applies the same FAIR principles to item response data. It brings together hundreds of existing datasets and reshapes them into one common format — so that a method tested on one dataset can easily be tested on hundreds of others.
What is in the IRW
The IRW contains hundreds of datasets (“tables”), each one a collection of individual responses. A response is generated whenever some person (or other unit) responds to some item (or other probe). Examples include:
- Student answers on education and ability tests
- Survey items measuring personality or attitudes
- Ratings assigned by human raters
- Any other setting involving repeated responses to a set of measurement probes
Every dataset in the IRW is designed to be:
- Findable. Each dataset comes with pre-computed metadata — participant and item counts, response density, subject area, and other descriptive tags — so datasets can be located and filtered without downloading them first.
- Accessible. Every dataset can be retrieved through the web browser or the
irwpackage, using a free account. - Interoperable. Each dataset is reshaped into the same simple long-format structure (described below), so the same analysis code can run across many datasets with little or no modification.
- Reusable. Each dataset is openly licensed, its origin is documented, and the code used to convert it into the IRW format is public.
Datasets vary widely in size (from a few hundred responses to many millions) and in response type (yes/no items, multi-category ratings, partial-credit scores, and more). Each dataset also comes with pre-computed metadata — number of participants, number of items, response density, subject area, and other descriptive tags — so that researchers can find relevant datasets without first downloading and processing all of them.
The data standard
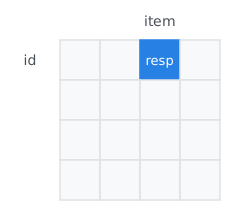
Every IRW dataset is reshaped into long format: one row per response. At minimum, each row has three pieces of information:
| Column | Meaning |
|---|---|
id |
Who (or what) produced the response — typically a person |
item |
Which measurement probe produced the response — typically a question or task |
resp |
The response itself, stored as an ordinal score |
Example:
id |
item |
resp |
rt |
cov_age |
rater |
|---|---|---|---|---|---|
| 1 | Q1 | 1 | 2.3 | 26 | a |
| 1 | Q2 | 0 | 1.8 | 26 | a |
| 2 | Q1 | 1 | 2.1 | 31 | b |
| 2 | Q2 | 1 | 2.5 | 31 | b |
When a dataset includes extra information — response time, rater identity, covariates such as age — that information is stored in additional, consistently named columns. This one simple structure covers a huge range of measurement situations, which is what makes it possible to write analysis code once and apply it across the entire warehouse.
The full technical specification of the standard is available at itemresponsewarehouse.org/standard.html. Related, more specialized standards also exist for item text, pairwise-competition data, and nominal (unordered category) responses.
How to use it
There are three ways to get IRW data, depending on how much you want to automate.
1. Browse in the web browser Explore datasets and their metadata directly on the IRW data browser — no account needed. Downloading a full dataset requires a free Redivis account, since that is the platform that hosts the underlying data.
2. Use the irw package (recommended) The irw package, available for both R and Python, gives simple functions for finding, filtering, and downloading data.
# R
devtools::install_github("itemresponsewarehouse/Rpkg")
library(irw)

irw_info()                     # overview of the IRW
irw_list_tables()              # list all available tables
irw_filter(var = "rt")         # find tables that include response times
df <- irw_fetch("4thgrade_math_sirt")   # download one table
# Python
# pip install irw
import irw
irw.info()
irw.list_tables()
irw.filter(var="rt")
df = irw.fetch("4thgrade_math_sirt")The first time you use the package, you will be asked to log in with a free Redivis account. After that, one line of code downloads any dataset directly into R or Python. From there, the data is ready for analysis with standard software — for example, item response theory or factor analysis packages.
3. Use the Redivis client libraries directly For lower-level or non-R/Python workflows, the data can also be accessed through Redivis’s own R and Python client libraries. See the Getting Started guide for details.
Beyond downloading data
The IRW project also includes:
- A growing set of vignettes — worked examples applying classic and new measurement methods across many IRW datasets at once
- Training resources and problem sets for teaching psychometrics with real data
- A contribution process for researchers who want to add their own datasets to the warehouse
Learn more
- Domingue et al. (2025). An introduction to the Item Response Warehouse (IRW): A resource for enhancing data usage in psychometrics. Behavior Research Methods. doi:10.3758/s13428-025-02796-y
- Nadela, Lee, Jain, Gupta, Zhang & Domingue (2026). The Item Response Warehouse: What It Is, How to Use It, and Targets for Potential Improvements. Chinese/English Journal of Educational Measurement and Evaluation. doi:10.59863/CIJG4549
- Wilkinson et al. (2016). The FAIR Guiding Principles for scientific data management and stewardship. Scientific Data. doi:10.1038/sdata.2016.18
- Website: itemresponsewarehouse.org
- Code: github.com/itemresponsewarehouse
If you use IRW data in your work, please cite the original data (we have provided functionality for doing so). It would also be great if you cared to cite the introductory paper above.
Questions, feedback, or want to contribute a dataset? Visit the Contact page or open an issue on GitHub.